Estimate of Potential Economic Impact
Associated with “Aerotropolis” Legislation and an International
Freight Hub at Lambert-St. Louis International Airport (20/30)
Introduction
The Big Idea was never about two or three inbound cargo flights each week
from China. International air cargo is, however, where The Big Idea begins,
and the catalyst for St. Louis’ reemergence as a global center for
commerce and transportation.
St. Louis-based air cargo is the missing piece of a multi-modal infrastructure
system that today boasts enviable assets in highway, rail, and river transportation.
Only air cargo can deliver the speed-to-market essential for today’s
supply chains; which knit together from around the world components arriving
by varying modes of transport—all arriving at a preordained time
and place to be assembled into something more valuable than the sum of
their parts. Introducing and sustaining international air cargo service
in St. Louis will actually serve to stimulate and grow all other modes
of transport as well, taking full advantage of the region’s multi-modal
network.
The true vision of The Big Idea is about “re-internationalizing”
St. Louis as a vigorous cargo gateway; strengthening Lambert-St. Louis
International Airport through new landing fee revenues; and building a
more robust logistics cluster that invests hundreds of millions of dollars
in facilities and equipment, and employs thousands of area residents over
the next 20 years. But, it doesn’t work without air cargo as a catalyst.
Below is a response to the hypothetical question, “What level
of activity and impact could be ‘purchased’ if the state was
to entirely expend the $300 million1 in state tax credits set aside for
‘qualifying gateway facilities’ in SB390 by the time the program
sunsets?” The ultimate benefit to the state will be weighed
against the total potential cost of $360 million paid out over 15 years,
including the $60 million component for freight forwarders.
China has determined to grow their market share in air freight from 15-20%
to 50% for Chinese-made goods that fly between their country and the U.S.
They have the resources and political will to make this happen. They will
also establish an air cargo “bridge” to link China to Brazil
and the rest of South America by air. It’s not a question of whether
China will do these things; only whether they will do them in St. Louis.
Economic Development Potential of Air Cargo
Three airports in particular, none too distant from St. Louis, show the
power of introducing international air cargo to a passenger airport. All
have the added advantage of being home to one of the two largest expeditors,
UPS or FedEx, but remain great comparisons for illustrative purposes.
• Louisville – “The
expansion of Louisville International Airport has created more than twice
as many local jobs as experts projected when the city embarked on the
project in the late 1980s, according to the latest version of a long-term
economic impact study. The airport now generates more than 55,000 jobs,
according to the University of Louisville study, which is updated every
three years. It also generates nearly $2 billion in payroll and $277 million
in state and local taxes – more than four times the original projection
in those categories, according to the study. Almost all the impact can
be attributed to the UPS Worldport global air hub …”
• Memphis – “A
new study released this week confirmed the airport’s muscle, estimating
that Memphis International pumps $28.6 billion into the region’s
economy and provides, directly or indirectly, 34.2 percent – or
one in three – local jobs. The economic impact study was commissioned
by the Memphis-Shelby County Airport Authority and conducted by the Sparks
Bureau of Business and Economic Research at the University of Memphis.
Cargo accounted for $27.1 billion of the total economic impact and 208,319
of the 220,000 jobs related to the airport, according to the study.”
• Indianapolis – Although
Indianapolis International Airport is only the 45th largest U.S. airport
in terms of passenger traffic, it is the nation’s 8th largest cargo
facility and 21st in the world due to a major presence by FedEx. Because
of this added revenue from air cargo, and in spite of just completing
a new $1.1 billion midfield passenger terminal, the following is true.
“In most U.S. cities, the rates airlines pay are forecasted to increase.
In Indianapolis, however, those costs will actually decrease steadily
over the next five years, which will make Indianapolis International more
attractive for additional or expanded air service.”
Several additional examples\ of U.S. inland ports offer a glimpse of what
an international freight hub can become over a 10 – 20-year period.
What is very clear from the examples to follow, though each is unique,
is that the investment and job-creating power of effectively combining
air transport with a robust rail and highway infrastructure is incredible.
Add to that the advantage of St. Louis’ location at the confluence
of the nation’s two largest rivers, and China’s entry into
the marketplace -- and the potential multiplies exponentially.
• Rickenbacker / Columbus
Inland Ports - Columbus, Ohio. Rickenbacker is a 5,000-acre all-cargo
airport, which anchors the southern end of a 15,000 acre industrial zone.
It contains over 22 million sf of class “A” distribution and
logistics space that employs over 15,000 workers. The Rickenbacker Port
Authority has developed 10 million sf over the last 10 years in the FTZ
industrial park. An additional 12 million sf have been developed in 12
other industrial parks in the Rickenbacker area over the last five years.
• Port of Huntsville –
Huntsville, Alabama. The Port of Huntsville is an inland port complex
located in Northern Alabama comprised of three facilities: Huntsville
International Airport, the International Intermodal Center, and Jetplex
Industrial Park. A 2008 economic impact study for the Port of Huntsville
summarized its findings as follows, “These employment and payroll
figures are larger than those reported in similar impact studies for the
airports in Birmingham, Nashville and the passenger-only part of the Memphis
Airport.” Note that Huntsville’s metro population is approximately
450,000 – compared to Birmingham at 1.2 million, Nashville at 1.6
million, and Memphis at 1.3 million.
• San Bernardino International
Airport (SBD) – San Bernardino, California. Located 60 miles east
of the Los Angeles International Airport, SBD is surrounded by major interstate
freeways and is within two miles of the BNSF intermodal facility. Alliance
California is a 2,000-acre “trade and logistics” center adjacent
to SBD and operated by the Hillwood Group, who is also the developer of
the Alliance Global Logistics Hub in Ft. Worth, Texas. There are multiple
buildings in existence or under development at Alliance California totaling
roughly 64 million square feet. Hillwood estimates that over 29,000 jobs
have been created at Alliance California since 2000.
• Alliance Global Logistics
Hub – Ft. Worth, Texas. A 17,000-acre, master-planned development
built around Ft. Worth Alliance Airport, the world’s first 100%
industrial airport, with two Class I rail lines, and multiple interstate
highways. Launched in 1989, this development is estimated to have more
than 170 companies and 28,000 employees.
• Port of San Antonio –
San Antonio, Texas. The Port of San Antonio was created out of the closing
of Kelly Air Force Base in the 1995 round of Base Realignment and Closures.
An economic impact study6 performed in 2010 summarized its annual impact
as follows. “The business operations at Port San Antonio generated
an (annual) economic impact of about $4.14 billion. This activity supported
employment of about 24,216 full-time equivalent positions and paid incomes
to these workers of $1.68 billion. The value added is estimated at over
$2.65 billion, and the total fiscal impact was $467 million to the federal,
state and local governments.”
Estimated Impact of SB390 Economic Pro Forma
The assumptions above were provided by the RCGA to Princeton-based Biggins
Lacy Shapiro (BLS) who is working in tandem with the international logistics
advisory firm Institute St. Onge to conceptualize how the introduction
of international air cargo in St. Louis catalyzes the entire multi-modal
transportation cluster and evolves into a legitimate international cargo
gateway. Based on those specific assumptions, BLS / St. Onge’s modeling
suggests the following economic impacts.
Cumulative Construction Impact: 2011 - 2018
(SB390 requires facilities built within 8 years):
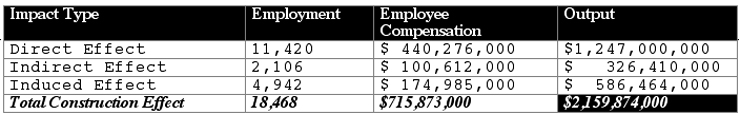
|
. Notes:
. Total construction employment represents the total number of full time
equivalents (FTE) positions created during the project’s eight-year
construction period. This is not the number of people employed. Individual
employees may have more than one job during the multi-year construction
process.
. Output and employee compensation presented in 2011 dollars.
Cumulative Operations (Full Time
Jobs) Impact: 2011 – 2025
(SB390 incentives paid out over 15 years)
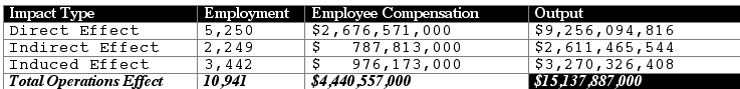 |
. Notes:
. Operations jobs represented as full time equivalents (FTE) positions
per year.
. Output and employee compensation presented in 2011 dollars.
Total combined output over 15 years: $17.3 billion. These estimated
impacts are for the 8-county Missouri portion of the St. Louis metropolitan
area and the rest of the state of Missouri.
Using the same methodology, the combined output over 20 years (2011 –
2030) is $26.8 billion.
State Financial Returns
The construction and operations impacts above, along with the Key Assumptions
on page 5 were provided to St. Louis-based Development Strategies to calculate
revenue returned to the state at 15 and 20-year intervals. Based on Development
Strategies’ modeling, the cumulative effect of individual and corporate
income taxes, state sales and use taxes, and all other state taxes would
be approximately $347 million over 15 years and approximately $460 million
over 20 years.
Key Assumptions for SB390 Economic Pro Forma
. $300 million of Aerotropolis incentives, fully subscribed, will generate
$1.25 billion of new construction
. $150 million as 30% credit yields $495 million of new investment
. $150 million as 20% credit yields $750 million of new investment
. $1.25 billion of new construction will be configured as follows
. 15% by value ($187 million) will be dedicated air cargo space built
at $85 psf.
. Generates 2,200,000 sf of air cargo space
. 85% by value ($1.06 billion) will be warehouse space built at $54 psf
. Generates 19,600,000 sf of warehouse space
. Total of 21.8 million sf of new construction
. Average cost of equipping facilities estimated at $15 psf
. Facilities built out over 8-year period at following growth rate:
. 2011 – 5%
. 2012 – 20%
. 2013 – 25%
. 2014 – 30%
. 2015 – 5%
. 2016 – 5%
. 2017 – 5%
. 2018 – 5%
. Employment projections based on densities consistent with St. Louis
warehouse and transportation market, which are more conservative than
densities for manufacturing employment
. Whse: 7,328 sf per employee7
. Transp: 9,587 sf per employee8
. NOTE: You have both in each facility – not exclusively one or
the other
. Total new employment projections based on 8-year build-out of new facilities
and employee densities listed above
. Whse: 2,975 employees (21.8M sf ÷ 7,328 sf per employee)
. Transp: 2,274 employees (12.8M sf ÷ 9,587 sf per employee)
. 5,249 new direct employees over 8 years
. Further employment assumptions for IMPLAN model
. Employment ramps up at same rate as facilities over 8 years
. Payroll then grows at an inflationary factor calculated by IMPLAN for
7 years (years 9 – 15)
. 35% of the jobs are classified as “other miscellaneous manufacturing”
and use the existing IMPLAN data for calculating wages and benefits
. 35% of the jobs are classified as “warehouse and transportation”
and use the existing IMPLAN data for calculating wages and benefits
. 30% of the jobs are classified as “air cargo” and use the
existing IMPLAN data for calculating wages and benefits
Economic Impact Definitions
The economic impact of a business, organization, or event is a measure
of the amount of, and the way that, dollars associated with that entity
circulate through the region. The estimates presented in this summary
were developed with a computer model called IMPLAN, which stores a profile
of the St. Louis MSA economy in a database. The model uses production
functions for each industry in the region to calculate how spending in
one industry circulates through other industries in the St. Louis MSA.
This economic impact can be expressed either as an annual flow of dollars
(output) or an equivalent number of employees.
There are three levels of impact that are considered when developing these
figures: the direct impact, the indirect business spending impact, and
the induced household spending impact. All three can be expressed in terms
of an annual flow of dollars (output) or annual jobs. The total impact
is the sum of these three factors.
. Direct Impact
. This is the most basic part of an organization’s economic impact.
It measures the dollars and jobs that the organization directly generates.
When expressed in dollars, the direct impact is an approximation of a
company’s output. Alternatively, the direct impact is the average
annual value of output associated with the given number of jobs in that
industry.
. Indirect Business Impact
. This is a secondary measure of a business’s economic impact. It
represents the dollars and jobs generated by the operating expenses of
the organization. Examples might be purchase of raw materials from a local
supplier or the professional services of an accounting or law firm. This
spending generates revenue and employment at firms that supply those goods
or services. Every dollar that an organization spends locally to conduct
its business supports another business in some way.
. Induced Household Spending Impact
. This is a tertiary measure of a business’ economic impact. It
is a measure of the business revenue generated by the personal spending
of the organization’s employees. Think of an employee at an organization
spending money at the local grocery store. The employee’s paychecks
support revenue and jobs the same way that the organization’s spending
on equipment supports revenue and jobs.
IMPLAN DEFINITONS
Output represents the value of industry production. For manufacturers
this would be sales plus or minus change in inventory. For service sectors
production = sales. For retail and wholesale trade, output = gross margin
and not gross sales.
|